Chrome DevTools MCP vs Playwright MCP for Debugging
Choose DevTools MCP or Playwright MCP for your own page: compare UI state, request details, Chrome performance traces and isolated versus existing sessions.
BotBrowser Team
Want the structured docs for Getting Started?
This article lives in the editorial library. For step-by-step setup, reference material, and ongoing updates, jump into the docs section.
Chrome DevTools MCP versus Playwright MCP is a choice about the evidence needed to debug a page you own. Start with Playwright MCP when the question is whether an interaction reached the intended page state; start with Chrome DevTools MCP when the question requires a Chrome performance recording and its insights. Both servers can interact with pages and inspect network activity, so neither label is an exclusive capability boundary. BotBrowser can supply the Chromium executable and profile used by a compatible Playwright launcher, but it does not register MCP tools, turn a click into a verified application write, or supply either server's analysis.
TL;DR
- A successful Save click establishes less than a fresh page observation. A visible confirmation establishes less than a durable backend write.
- Playwright MCP exposes accessibility snapshots, interaction tools, console messages and network request details. Its documented optional DevTools capability also includes tracing tools.
- Chrome DevTools MCP exposes accessibility snapshots and interactions alongside Chrome performance trace recording and insight analysis. Choose that evidence when investigating rendering or load timing.
- A clean isolated session and an already authenticated browser answer different reproduction questions. Both projects document ways to work with existing browser state.
- Match the installed server's active tool list and arguments to the pinned documentation. The examples below are synthetic debugging plans, not recorded runs or speed comparisons.
Contents
- Choose the question before the server
- Capabilities overlap but evidence differs
- A settings Save needs state evidence
- Slow navigation needs a bounded timeline
- Session selection changes the reproduction
- Carry one evidence record between tools
- Where BotBrowser fits
- Practical conclusion
Choose the question before the server
Suppose an owned settings page has a display-name field, a Save button and a confirmation message. A second owned page sometimes feels slow after navigation. These are illustrative application behaviors, not observations from a live service. The useful first split is whether the missing fact concerns an action, the page state after it, a request, or the browser's timeline. Those facts require different observations even when one server can produce several of them.
The Chrome DevTools MCP tool reference includes page interaction, network inspection and performance tools. The Playwright MCP README describes structured accessibility snapshots and provides its own interaction, network and optional tracing tools. Tool availability alone therefore produces an incomplete comparison. The deciding question is which output can distinguish the competing explanations of the bug.
| Debugging question | Evidence to request | Starting choice | What remains unknown |
|---|---|---|---|
| Did Save reach the intended control? | Current accessibility snapshot, target and action result | Playwright MCP interaction loop | Whether the application accepted the change |
| Does the page now show the new name? | Fresh snapshot after the action and the application-defined completion condition | Either server's snapshot tools | Whether the value survives another read |
| What did the save request return? | Matching request details, response body and application error fields | Either server's network tools | Whether the response represents a committed write |
| Why did the page render late? | Chrome performance recording covering the navigation and relevant insight details | Chrome DevTools MCP performance tools | The complete backend explanation |
| Does the issue require the existing login? | The same authorized session, then a separate controlled reproduction | Either server's documented attach route | Whether an isolated session behaves identically |
The table is a choice rule, not a ranking of vendors. A UI observation is sufficient for a UI-state question, while a rendering hypothesis needs timing evidence. The MCP protocol and browser-state explanation separates the tool's returned representation from browser state and model context. A server can control the right page while returning too little information to establish the claim being made.
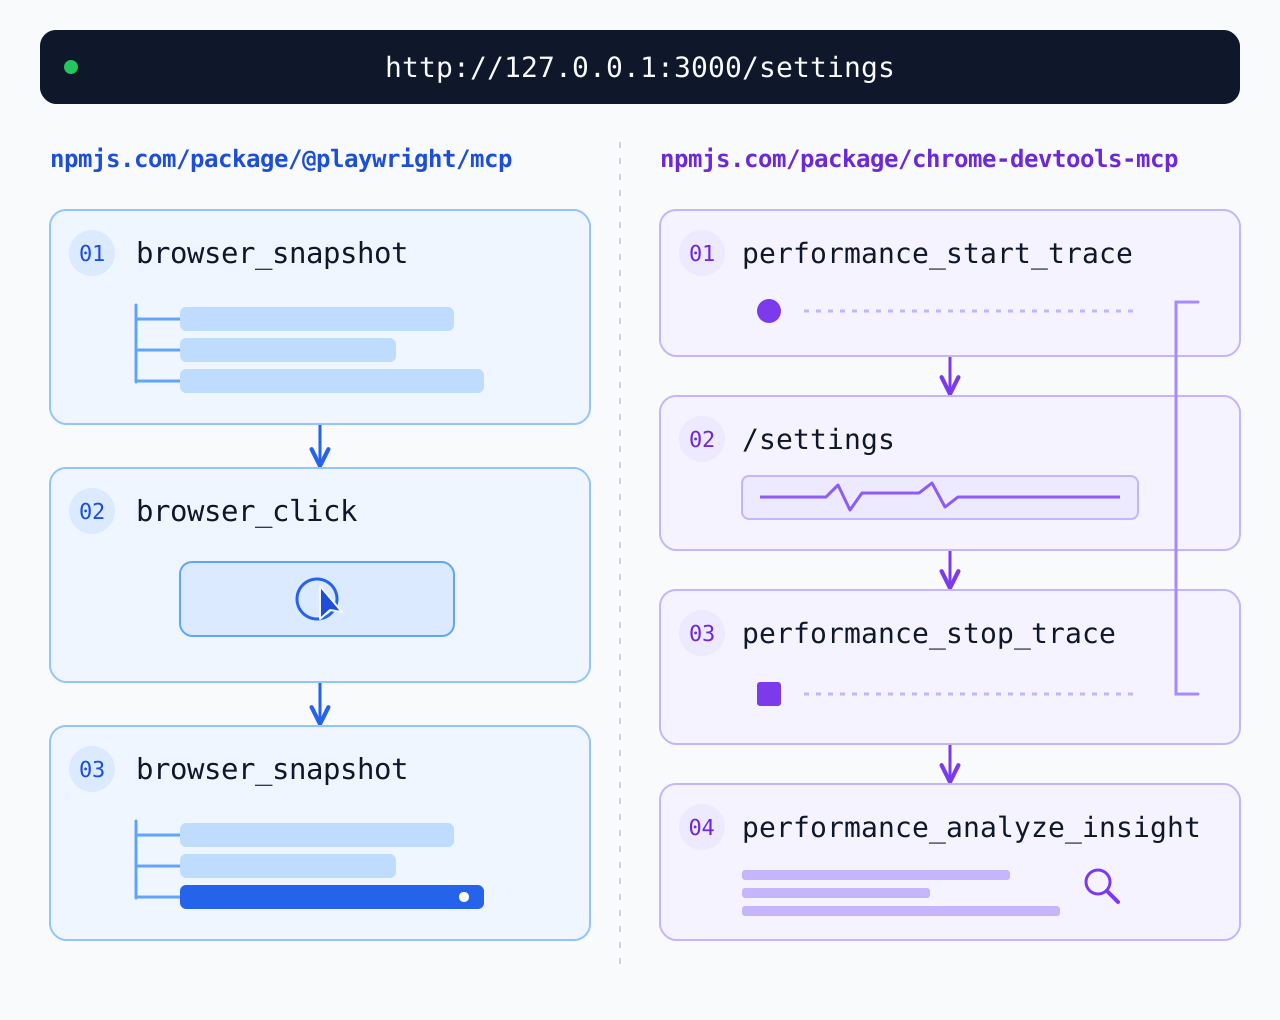
The figure represents the questions and evidence boundaries. It contains no measured durations, execution counts or observed application results. Moving from the Save path to the timeline path means changing the question or collecting another artifact; it does not mean that an interaction tool has established a timing cause.
Capabilities overlap but evidence differs
At the pinned Chrome revision, take_snapshot returns a text representation based on the accessibility tree and assigns element identifiers. The reference explicitly says to use the latest snapshot. click takes a pageId and an element uid; its optional includeSnapshot argument defaults to false. A caller should consequently avoid assuming that every successful click reply includes a fresh description of the resulting page.
At the pinned Playwright revision, browser_snapshot captures the current page's accessibility representation. browser_click accepts a target obtained from that snapshot or a unique selector. This is not the same argument schema as Chrome's pageId plus uid. The published Playwright tool catalog also lists browser_network_requests and browser_network_request, so a request-response investigation is not automatically a reason to switch servers.
| Evidence family | Chrome DevTools MCP names | Playwright MCP names | Interpretation boundary |
|---|---|---|---|
| Accessible page state | take_snapshot | browser_snapshot | Represents exposed page semantics, not all pixels or server state |
| User interaction | click, fill, fill_form | browser_click, browser_fill_form | An executed action needs a separate outcome check |
| Request inspection | list_network_requests, get_network_request | browser_network_requests, browser_network_request | Request identity and response semantics still matter |
| Trace recording | performance_start_trace, performance_stop_trace | browser_start_tracing, browser_stop_tracing with optional DevTools capability | Shared wording does not establish identical trace contents |
| Chrome performance insight | performance_analyze_insight | Do not infer a matching tool from the tracing names | Use the catalog and the actual artifact for the required analysis |
The tracing row is a particularly useful counterexample to a common shortcut. The Playwright README places its tracing tools under DevTools, opt-in through --caps=devtools. Calling Playwright MCP an interaction-only server would omit a documented capability. Conversely, the existence of a tracing command does not establish that its output has Chrome's Performance Insight sets or accepts their identifiers. Compare the actual artifact and analysis interface rather than treating every use of the word trace as equivalent.
Configuration can narrow the catalog as well. The Chrome configuration reference allows categories such as performance, network and debugging to be disabled. The pinned documentation defines a reproducible reading target; it does not prove what a running instance currently offers. Record the package version and inspect discovered tool schemas before copying an invocation from another environment.
A settings Save needs state evidence
For the synthetic settings page, define success as two separate conditions: the interface confirms the submitted display name, and an independent application read returns that name. The first belongs to the browser observation. The second depends on the owned application's persistence contract. A response that merely acknowledges queued work would not satisfy the second condition until the application's later read confirms it.
With the Playwright MCP interaction tools, the sequence starts from a fresh snapshot, identifies the field and Save control, performs the authorized edit once, and obtains a new observation after the application's completion condition. Read the changed value and confirmation together. A success toast beside an unchanged display name is materially different from both agreeing, even though both pages might contain the word saved.
The equivalent Chrome sequence uses the current page identifier, fresh uid values and fill or fill_form followed by click. Because the Chrome click definition does not include a snapshot by default, request one explicitly or call take_snapshot afterward. An identifier copied from an earlier document is not a reliable substitute for observing the current form after navigation or a rerender.
The following is a copyable worksheet for the owned fixture. It is an investigation plan with blank evidence fields, not fabricated tool output:
Question: Does one Save update the display name?
Target: owned settings page and designated test account
Initial state: record current field value and current page identity
Action: enter one replacement value and activate Save once
UI evidence: capture the new field value and completion message
Request evidence: identify the matching save request and response
Persistence evidence: read the saved value through the owned app's contract
Unresolved: record any boundary that the collected evidence cannot cross
If the UI disagrees with the response, preserve both observations. A browser snapshot can show an optimistic value while the request is rejected. A successful response can arrive while the page fails to update. These are different defects, and choosing the server before naming the discrepancy can obscure the distinction. The Playwright request-detail tool can supply the headers and body for the selected request, rather than leaving the investigation at a list of URLs.
An ambiguous tool failure also needs care. If the click ran but the reply was interrupted, repeating Save immediately introduces another action before the first outcome is known. Observe the page and corresponding request first. Whether repetition is harmless depends on the application's semantics, not on the server's brand. For this synthetic name edit, a repeated value might be tolerated; that does not justify transferring the same retry assumption to a different form.
Slow navigation needs a bounded timeline
A settings interaction can be correct while the next page is slow to paint. An accessibility snapshot taken after loading cannot establish which earlier browser activity consumed the time. It describes the resulting state at an observation point. The useful artifact for a Chrome rendering question is a recording that actually spans the slow interval, together with the conditions under which that interval occurred.
The Chrome performance tools provide a specific workflow. Navigate the target page to the right URL before starting when using reload or autoStop. Start recording, reproduce the relevant navigation or reload, stop the recording when appropriate, and retain the trace artifact. performance_analyze_insight requires an insightSetId returned in the available insight sets and a relevant insight name. Those are run-specific inputs, not labels to invent from an example.
For the synthetic slow page, separate three candidate explanations: a late document response, expensive frontend work after the response, and a resource that delays the visible content. The recording should help determine which candidate deserves further investigation. An insight such as DocumentLatency or LCPBreakdown, both named as examples in the reference, is a browser-side diagnostic starting point. Its presence is not a claim that the application has a particular database or backend bottleneck.
Cache conditions change that investigation. Chrome's performance_start_trace documents ignoreCache for bypassing the HTTP cache when reloading, and states that it applies only when reload is true. Record that choice explicitly. A cold reload and an already visited navigation do not represent the same user path. The tool reference also notes that active network mocks disable the page HTTP cache, so a mocked reproduction needs that condition attached to its interpretation.
| Synthetic observation | Supported next question | Unsupported conclusion |
|---|---|---|
| The page eventually contains the intended heading | Did the navigation reach the intended page state? | The rendering path was fast |
| A trace covers the late visible update | Which recorded browser activities overlap the delay? | Every user's navigation has the same cause |
| A request response arrives late in that recording | Which owned server logs correspond to this request? | The database is necessarily responsible |
| A warm repeat is quicker than a cold reload | Which cache and session conditions changed? | One MCP server is intrinsically faster |
Playwright's optional tracing remains a valid counterexample to the claim that every timeline investigation requires changing servers. If an already available Playwright artifact supplies the evidence needed for the narrower question, keep it. Choose Chrome's performance tools when the next required step is its documented performance recording and insight interface. The Playwright MCP DevTools catalog supports tracing availability; it does not by itself establish an output-equivalence claim.
Session selection changes the reproduction
The synthetic Save bug might appear only after a previous preference change. Starting in an isolated browser could remove that prerequisite and make the symptom disappear. An existing session preserves useful context, but also preserves possible confounders: authentication, previous navigation and local application state. The right choice depends on whether the question concerns the affected session or a controlled starting state.
The Playwright profile documentation describes a persistent profile as the default, isolated sessions through --isolated, and existing tabs through its Chrome extension. It also documents CDP endpoint configuration. Isolated sessions lose their session storage state when closed; an initial storage-state file can supply cookies and local storage for an authenticated setup. That imported state is a specific input, not proof that the entire original browser environment has been reproduced.
Chrome's session configuration gives --isolated a temporary user-data directory that is cleaned up after browser closure. It also provides --userDataDir for a chosen directory, --browserUrl or --wsEndpoint for a running debuggable browser, and --autoConnect under its documented Chrome and remote-debugging prerequisites. Chrome's default is not isolated either. The phrase DevTools MCP therefore does not, by itself, imply attachment to a developer's current tab.
For a bug that depends on existing state, first capture the affected authorized session's visible conditions. Then create a separate reproduction with the required state deliberately established. If the second case fails to reproduce, record the difference rather than merging the results into one conclusion. The persistent-profile warning in Playwright's README also matters for parallel clients: one persistent profile can only be used by one browser instance at a time. Use separate isolated sessions or distinct directories instead of interpreting a profile conflict as an application failure.
Carry one evidence record between tools
Switching from UI inspection to performance analysis is useful only if the second observation refers to the relevant page and reproduction. Preserve the target URL, selected tab, test account, input value and session mode before moving between tools. Otherwise a clean performance recording can be accurate for a different page state and still answer the wrong question.
Use a small evidence record rather than copying an entire browsing history into the investigation. The MCP message-boundary discussion explains why the result returned by a server and the context retained by a host are separate objects. A file path in a tool reply does not establish that the host opened the artifact, and a short summary may omit the detail needed for the next diagnostic step. The pinned Chrome configuration defaults performanceCrux to true, sending URLs from performance traces to the CrUX API for field performance data. For an owned page behind login, use --performance-crux=false unless that lookup is needed, and --redact-network-headers=true: header redaction defaults to false and covers only some sensitive network headers before returning them to the client. It is not a general URL or body scrubber. Retain only the route, session conditions and observation needed for the question, omitting unrelated content and account data.
Reproduction identity: owned route, test account, application revision
Session conditions: isolated or existing, supplied state, selected tab
Action boundary: one Save or one specified navigation
Observation boundary: snapshot point, request identity, trace interval
Artifact location: retained snapshot, response details or trace file
Supported claim: the narrow fact established by those artifacts
Open question: the next fact requiring application or server evidence
Keep the browser conditions attached to this record when comparing iterations. A changed cache mode, restored storage file or different route can explain an apparent improvement without any application fix. This record is not a benchmark protocol, and no durations are supplied here. It preserves the inputs needed to decide whether two observations are comparable before drawing a conclusion from them.
Where BotBrowser fits
The BotBrowser Playwright integration guide demonstrates launching a selected executable with the profile argument and describes framework-specific initialization. That is the browser-launch layer. An MCP server adds another configuration and tool layer above it. A working direct Playwright launch does not establish that a server forwards the same executable, arguments or initialization behavior.
The Playwright MCP configuration article covers that executable and profile handoff. Use it when the debugging session must run a particular Chromium build. Record the actual launch configuration and verify the intended browser separately from the application's Save result. The pinned Playwright MCP configuration schema includes browser launch options, while Chrome's configuration separately exposes a custom executable option. Similar options do not establish compatibility of every custom build, attached session or performance tool.
BotBrowser's role in this comparison ends at the controlled browser behavior and supported integration. The server still owns the exposed tool catalog; the application still owns what saved means; the recording still needs to contain the slow interval. Replacing the executable cannot manufacture missing request details or turn a UI confirmation into a persistence check. The integration documentation covers how to start the browser, while the evidence worksheet determines what must be observed after it starts.
FAQ
Does Chrome DevTools MCP only inspect pages while Playwright MCP clicks?
No. The pinned Chrome tool reference includes click, fill and navigation tools. The distinction is useful for selecting diagnostic evidence, not for assigning exclusive interaction ownership to one project. A current tool listing can be narrower if the server configuration disables categories.
Is an accessibility snapshot enough to check a visual defect?
Not necessarily. A snapshot exposes accessible structure and state, while a spacing, clipping or color defect may require a screenshot at the relevant viewport. The Playwright screenshot documentation in the tool catalog distinguishes snapshots used for actions from screenshot-based observation. Choose the representation that contains the disputed property, and retain the viewport with a visual comparison.
Does either server guarantee that a successful Save is durable?
No browser-side tool result supplies that guarantee on its own. A snapshot can establish the displayed value, and Chrome request inspection can expose the response. Durable persistence requires the owned application's documented read-after-write or server-side verification. A reload is useful evidence only when that application's reload path actually reads the authoritative saved value.
Can an existing Playwright session be enough for debugging?
Yes, when its available observations answer the question. The Playwright MCP README documents existing-browser connection routes and optional tracing. Reuse a suitable authorized session when preserving its state is part of the reproduction; establish a separate isolated case when the question requires a controlled start.
Sources
- Chrome DevTools MCP tool reference, revision 371975e2423abefa8335f0a6d18c47c8cdda037f.
- Chrome DevTools MCP configuration, the same revision.
- Microsoft Playwright MCP README, revision 16347fa7f878b33442b4b9d5ed34b76a99a5266c.
- BotBrowser Playwright integration.
Practical conclusion
Choose Playwright MCP for a snapshot-led interaction investigation when its active tools supply the needed state and request evidence. Choose Chrome DevTools MCP when the question needs its Chrome performance recording and insight interface. Both can participate in the same diagnosis, provided the session, page and reproduction remain explicit. Start with one owned route, choose an isolated or existing session deliberately, and check the active catalog for the observation that can resolve the next unknown.
This article is part of the guide: Browser Automation Getting Started: A First Run Map
Related Articles
Headless Browser for AI Agents: Launch and Tool Boundaries
DeploymentBrowser Automation MCP: What the Protocol Carries
Getting StartedPlaywright Trace Viewer for Authorized Test Debugging
DeploymentPlaywright MCP Setup for a Custom Chromium Build
Getting StartedPlaywright Wait for Response After Click: Fix the Race
Getting StartedScraping with Playwright: Browser and Profile Setup
Run the same check in BotBrowser
Load a profile, keep the signals you just read about consistent inside the browser, and confirm the result on your own machine before a rollout.