SERP Scraping at Scale: Browser Requirements
Plan SERP scraping at scale by measuring pages per hour, startup delay, browser capacity, and network wait separately before committing to a browser setup.
BotBrowser Team
Want the structured docs for Deployment?
This article lives in the editorial library. For step-by-step setup, reference material, and ongoing updates, jump into the docs section.
SERP scraping at scale is a workload-planning problem: the browser must sustain a required pages-per-hour target without making startup, rendering, or memory the hidden bottleneck. The measurement plan here uses an owned fixture or an explicitly authorized target/API; it gives no live SERP collection instructions. BotBrowser provides a configurable browser runtime for a controlled comparison, but it does not schedule jobs, decide whether collection is permitted, or guarantee a third party's response. A buying comparison measures browser work separately from network wait.
TL;DR
- Set a target in completed pages per hour and a maximum acceptable latency, then measure both rather than inferring capacity from launch time.
- Compare the same representative page set at two planned concurrency levels; record browser startup, page-ready time, memory, and failures.
- Keep browser configuration fixed while measuring network wait, then change one browser-side variable at a time.
- Treat the worksheet and formula below as a measurement plan, not as BotBrowser benchmark results.
- Measure only an owned fixture or an explicitly authorized target/API; no live collection procedure is included.
Contents
- Translate workload into browser requirements
- Separate browser time from network time
- A reusable measurement plan
- Practical conclusion
Translate workload into browser requirements
“At scale” has no single browser count hidden inside it. A planning target needs at least a page volume, an observation window, a page-ready definition, and an acceptable completion-time range. If a job needs 12,000 completed pages in 4 hours, the arithmetic target is 3,000 pages per hour. This is an example calculation, not a measured browser capacity or a recommendation about collection volume.
Pages per hour is more useful than browser launches per hour because a launch is only setup. The workload also pays for creating a context, navigating, running page scripts, waiting for the chosen readiness condition, and storing the result. A browser that starts quickly but spends most of each job waiting on page work may miss the target. Conversely, a slow initial launch can be amortized when a supported design reuses a browser process or context. The performance optimization documentation covers runtime tuning; workload requirements belong in the pre-purchase comparison.
Latency needs a definition too. Record time from navigation start to the exact readiness signal the workload needs, not an unspecified “page loaded” event. A SERP may have useful content before every image or deferred resource completes, but choosing a different readiness condition changes the result. Keep that condition identical across comparisons and document it alongside the result.
| Requirement field | Example value | Note |
|---|---|---|
| Completed pages | 12000 | Total work, not launch count |
| Observation window | 4 h = 14400 s | Available elapsed time |
| Readiness signal | page-ready after the required content exists | Must stay fixed |
| Average target | 12000 / 14400 * 3600 = 3000 pages/h | Arithmetic requirement only |
| Latency objective | p95 <= 20 s for the same readiness event | Tail limit, not an average |
The formula makes the requested average explicit; it does not predict a browser, host, route, or response capacity. Startup, scheduled pauses, retries and persistence consume part of the window, so record them instead of hiding them in the aggregate. A fleet can meet 3,000 pages/h while a subset takes longer than 20 s, which is why the rate and the p95 objective belong in the same requirement.
Define a completed page before comparing products. The browser can report when the selected readiness event occurred, while validation or storage outside the browser may finish later. Keep those timestamps separate: a downstream bottleneck should not be mislabeled as browser latency, and faster result handling should not be credited as faster navigation.
Before observing a candidate, fix the sample and the stopping rule. Select a representative set of fixture pages, record the page count and complexity mix, and decide how many repetitions each concurrency level needs. For example, use 500 pages per repetition, 3 repetitions, and two planned levels such as 4 contexts and 8 contexts; these are worksheet inputs, not measured limits. Start each repetition from a documented browser state and retain failed or timed-out pages in the count.
Also decide how resource samples are collected. Record host CPU and memory allocation, the sampling interval, the browser build, profile identifier, launch mode and automation-library version. If a candidate needs a different proxy route, compare it only with a route the operator is authorized to use. Keep the fixture content, readiness event, host and route unchanged while testing one browser-side variable. Include the exact fixture identifier, setup fields and sample count beside every result so a repeat run uses the same inputs.
The same authorization rule applies when the workload changes from search results to employer-organized listings; job board scraping boundaries defines the public-listing allowlist and the stop conditions for authenticated data.
Separate browser time from network time
An observed duration combines several costs: browser startup and context work, proxy initialization, navigation, local rendering and script execution, network connection and response wait, plus any deliberate page wait in the workload. A slow observation alone cannot identify the responsible layer. The browser cannot make an upstream response arrive sooner, and a route change does not prove that browser startup was efficient. Use only an owned fixture or an explicitly authorized target/API for these comparisons.
Use a controlled baseline. Hold the browser build, profile, owned fixture or authorized page set, readiness condition, machine resources, and network route constant. Record browser startup, proxy initialization, navigation, and page wait as separate stages. Then vary one factor: for example, compare process reuse with fresh launches while leaving the route unchanged. To examine route effects, retain the browser setup and use only routes and targets that the operator is authorized to test. The proxy configuration documentation describes the network route as a separate configuration surface.
Context reuse and the chosen page-ready condition can change browser-side work without changing the route. The performance documentation describes runtime tuning for an already running deployment; this plan instead captures pre-purchase timing stages on a controlled fixture. Keep fixture behavior and readiness identical between comparisons, and record any browser-side option changed during a run. No selector, crawl logic, live SERP procedure, or access-control workaround is part of the measurement.
The performance optimization article covers runtime tuning after a deployment exists, while browser context capacity planning shows how measured memory curves set an admission boundary. This measurement plan keeps those layers separate: browser startup and page work are recorded separately from route and response wait, so a procurement comparison does not attribute every slow result to the browser.
| Stage | Start event | End event | What it can support |
|---|---|---|---|
browser_startup | launch requested | browser can accept workload action | cold-versus-reuse comparison |
proxy_initialization | route configured | first request can use the route | setup cost |
navigation | navigation start | selected readiness event | full page interval |
response_wait | request start | response headers or body available | observed network behavior |
completion | readiness event | downstream acceptance | non-browser cost |
The stages can overlap: several requests may be in flight while browser work continues. Adding every request duration to page-ready latency can therefore double-count time. Treat the table as attribution boundaries, not as proof that a runtime has one perfectly separable browser cost and one network cost.
Resource sampling needs a fixed interval, for example sample every 5 s, and a record of active contexts at peak memory. Processor use should come from the same window. If the host reaches CPU 100% or exhausts memory, the browser can slow down even though its configuration did not change; host capacity belongs in the test record.
Cold and warm work should not be mixed into one unexplained average. A first page can include process startup, profile loading, and initial setup that later pages do not repeat. If the intended workload starts a fresh process per unit, that cold cost is representative. If the intended design reuses a process, the warm path matters as well. Report both cases when both deployment patterns are under consideration, and state which one the procurement decision is meant to support. A faster warm path does not prove that the cold path will fit the same schedule.
A reusable measurement plan
The following worksheet is a plan to fill with observations from an owned fixture or explicitly authorized target/API; the values are blank because no run is represented here.
| Planned field | Record for each comparison | Why it matters |
|---|---|---|
| Workload | Owned fixture/API identifier and page-ready condition | Makes compared runs equivalent |
| Browser | Build, profile, launch mode, reuse choice | Identifies browser-side changes |
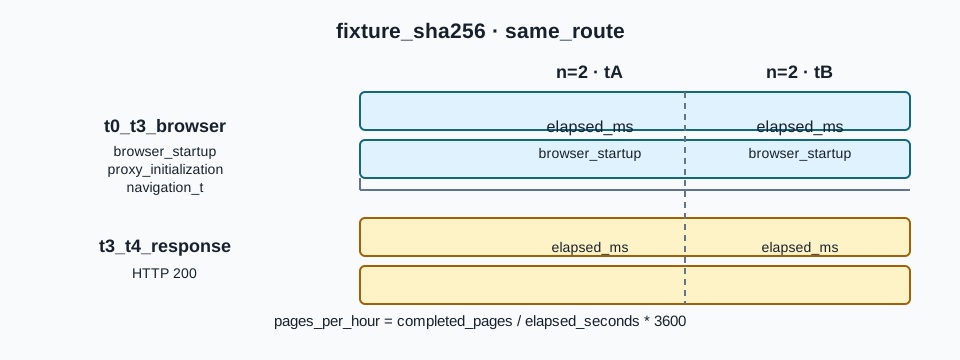
| Stage 1 | Browser startup duration | Isolates process initialization |
| Stage 2 | Proxy initialization duration | Separates route setup from page work |
| Stage 3 | Navigation duration | Records the full navigation interval |
| Stage 4 | Page wait until the fixed readiness condition | Keeps the completion rule explicit |
| Load | Planned concurrency: level A and level B | Shows whether the measured rate changes |
| Result | Completed pages, elapsed time, failures | Supports pages-per-hour calculation |
| Cost | Peak memory and the observed response wait | Exposes capacity and network pressure |
The worksheet should be treated as a minimum record rather than a complete test specification. Add the host CPU and memory allocation, operating system, browser build identifier, and any automation-library version when those differ between candidates. Record whether the browser ran headless or with a visible display, since a comparison is meaningful only when the modes match the intended deployment. If a candidate requires a different host shape, document that fact explicitly instead of attributing its result to the browser alone. The four timing stages are observation buckets, not a guarantee that every automation library exposes four non-overlapping measurements; state the event boundary used for each bucket.
For planning, a compact decision table can keep conclusions tied to evidence:
| Observation in the planned comparison | Interpretation to investigate | Next measurement |
|---|---|---|
| Startup or proxy initialization grows at level B | Setup work may be contending with concurrent jobs | Repeat at A and B while holding fixture and route fixed |
| Navigation grows while the other stages remain similar | The full navigation interval needs closer attribution | Keep the browser fixed and review response-wait observations |
| Page wait grows but navigation is stable | Readiness timing or page work may explain the difference | Recheck the same readiness event on the same fixture |
| Pages per hour changes little and peak memory rises | The host or browser workload may be resource constrained | Repeat both levels and inspect host resource samples |
| Browser stages stay similar while response wait changes | Network conditions may explain the difference | Keep browser configuration fixed and review an authorized route comparison |
These are interpretation prompts, not benchmark findings. A row describes what a future observation could mean and which variable to inspect next; it does not assert that a BotBrowser run produced that pattern. The same discipline applies to procurement summaries: include the configuration and the measurement window beside every result, and distinguish an observed difference from a causal explanation.
For each run, calculate pages_per_hour = completed_pages / elapsed_seconds * 3600. This formula normalizes a completed run; it does not predict the next run. Compare the same fields at two concurrency levels, such as a low-load baseline and a higher planned level, rather than treating a single result as a limit. If throughput stops increasing while browser memory or ready latency rises, the browser or host may be saturated. If browser-side measures remain stable while response wait changes, investigate the network path separately.
Repeat the plan enough times to see variation, and report the sample count and spread rather than only the fastest run. Keep failed and timed-out fixture pages in the record: removing them would make the apparent rate look better while hiding an operational cost. This is a measurement design, not a promise that two concurrency points establish a universal capacity ceiling.
An owned fixture should represent relevant page complexity while keeping sensitive query data out of a shared report. A stable fixture can preserve different rendering and script loads while using neutral labels. Record its identifier and the characteristics that matter to browser work, such as script activity, layout, and the content expected at readiness. Do not use a result from a few light fixture pages as a claim about every workload. Keep the exact fixture unchanged between candidates so browser differences are not mixed with content differences. If an authorized API is the target, identify the API operation, its documented response condition, and a public-safe sample that omits sensitive inputs.
Failures belong in the denominator and in a separate failure summary. A navigation timeout, a readiness condition that never occurs, and a downstream persistence error are different events. Label them by the stage that emitted them, retain their counts, and state whether the pages are included in completed output. A reported pages-per-hour value without an accompanying failure count can hide a low completion rate. The measurement record should preserve enough detail for another reviewer to understand whether the candidate completed the defined task, not just whether it generated browser activity.
The test window also needs a stopping rule. A short run may mostly measure startup, while a very long run can mix in unrelated host or route changes. Choose a duration or page count before observing outcomes, repeat under the same conditions, and note any interruption. Do not extend only the candidate that initially looks slower unless the revised plan is then applied consistently. This avoids changing the comparison after seeing which result is more convenient.
At the end, summarize three distinct quantities: requested average throughput, observed completed throughput, and the observed latency distribution. The first is a requirement; the second is a result for one recorded setup; the third describes the timing variation around those completions. None of them alone establishes a universal browser capacity. A procurement decision should also retain the setup record, resource allocation, failure counts, and the limits of the page fixture so later changes can be compared to the same baseline.
FAQ
Is launch time enough to estimate capacity?
No. Launch time omits navigation, readiness, page execution, and result handling. It is one useful component, especially when launches are frequent, but completed pages per hour is the workload-level measure.
Should every page use the same readiness condition?
Use the same condition within a comparison so that the runs are comparable. The condition should match the result the workload actually needs; waiting for unrelated resources can overstate browser work, while stopping too early can omit required content.
Does higher concurrency always increase throughput?
No. Additional concurrent pages can increase contention for CPU, memory, browser processes, or network resources. Measure at planned levels and treat a plateau or rising latency as evidence to inspect, not as a universal capacity limit.
Does BotBrowser determine whether a SERP workload succeeds?
No. BotBrowser provides the browser runtime and visible browser results for a controlled comparison. Work scheduling, network quality, third-party responses, and decisions about authorization remain outside that capability boundary.
Practical conclusion
Before choosing a browser setup for SERP scraping at scale, translate the workload into pages per hour and a defined readiness latency. Run a repeatable plan using an owned fixture or explicitly authorized target/API at two concurrency levels; record startup, proxy initialization, navigation, and page wait separately. Keep browser and network variables distinct, and use the comparison to identify which resource needs attention. The next action is to define the permitted fixture and readiness condition; no generic browser count can replace that baseline. This is not a guide to collecting live SERPs, selecting page elements, implementing crawl logic, or bypassing CAPTCHA, rate limits, or access controls.
Sources
This article is part of the guide: Browser Deployment and Release: Operations Map
Related Articles
Browser Automation Performance: Optimizing for Scale
DeploymentBrowser Profiles for SEO Monitoring and SERP Tracking
DeploymentBrowserContext Capacity Planning for Memory and Long-Running Sessions
DeploymentBrowser Container Resource Limits: A Practical Planning Method
DeploymentScaling Browser Contexts with Per-Context Profiles
DeploymentJob Board Scraping: Browser Boundaries
Run the same check in BotBrowser
Load a profile, keep the signals you just read about consistent inside the browser, and confirm the result on your own machine before a rollout.