PerformanceObserver for Browser Application Health
Observe owned performance entries, aggregate useful health signals, and control observer overhead without persistent user profiling.
BotBrowser Team
Want the structured docs for Platform?
This article lives in the editorial library. For step-by-step setup, reference material, and ongoing updates, jump into the docs section.
PerformanceObserver lets an application receive performance entries as the browser makes them available. It is useful for an owned question such as whether a route paints its main content before a service objective. It is not a complete diagnosis, a device benchmark, or permission to retain every timing value. The focus here is observer boundaries, entry selection, aggregation, and overhead.
PerformanceObserver role
Create an observer with a callback, then request only entry types that answer a decision. observe({ type: 'navigation', buffered: true }) can include an already-created navigation entry; observe({ type: 'paint', buffered: true }) can include paint entries when the browser supports them. Feature-detect each type and treat an empty list as valid evidence rather than inventing a value.
const allowed = new Set(['navigation', 'paint', 'largest-contentful-paint']);
const samples = [];
const observer = new PerformanceObserver(list => {
  for (const entry of list.getEntries()) {
    if (allowed.has(entry.entryType)) {
      samples.push({ type: entry.entryType, startTime: entry.startTime, duration: entry.duration });
    }
  }
});

try {
  observer.observe({ type: 'paint', buffered: true });
} catch {
  // Keep the page usable when this entry type is unavailable.
}
// Disconnect when the owned journey ends.
observer.disconnect();
The W3C Performance Timeline defines the common entry model. The MDN PerformanceObserver reference documents the constructor, callback, and browser-facing options. Neither source promises that every browser exposes every entry type or that an entry identifies the cause of a delay.
Keep one observer responsible for one bounded journey. Give the journey a run label, cap the number of retained samples, and disconnect on completion, cancellation, page transition, or error. A late callback must not update a component that has already been replaced. Do not use a broad observer as a hidden collector for unrelated application areas.
Select useful entries
Start from a user-visible outcome. Navigation entries can explain document milestones; paint entries can indicate when an initial visual result was reported; resource entries can show which owned dependency class is slow. Long-task entries can reveal main-thread contention, but they do not identify whether the page, an extension, or the operating system caused it. Use one entry type per decision and record the context that makes comparison fair.
| Situation | Record | Expected action |
|---|---|---|
| Supported type with entries | allowlisted type, aggregate, release label | compare with the approved service objective |
| Supported type with no entries | entry-empty and context | continue without a synthetic duration |
| Unsupported type | entry-unsupported | use the existing fallback and keep the journey usable |
| Callback volume exceeds cap | sample-cap-reached | stop collecting and aggregate retained samples |
| Journey ends or is cancelled | observer-disconnected | ignore late callbacks and release references |
Do not treat a browser entry as server truth. A resource duration includes the browser's observation of that resource; it does not prove backend time. Compare categories only when they share a declared fixture, route class, release, and observation window. BotBrowser controlled contexts can run authorized observer fixtures and compare visible outcomes, but BotBrowser does not guarantee identical entry support, scheduling, or production health on every runtime.
Aggregate and minimize data
Collect only fields needed for the decision: entry type, a bounded duration or start-time bucket, fixture id, release label, and outcome. Avoid raw URLs, query strings, text, account ids, and a long-lived per-user history. Redact names before export and prefer percentiles or counts over raw timelines. A short diagnostic run id can join browser and server records during an approved window, then expire.
PerformanceObserver callbacks can contain entries from several components when the allowlist is broad. Copy selected fields into an application-owned record and clear references after aggregation. Set a sample cap and a maximum observation window. If the callback is busy, drop optional samples rather than delaying the user interaction being measured. The observer itself must not become the health problem.
Privacy reduction, background scheduling, cache state, visibility changes, restored pages, and browser releases can all change observations. Label those contexts. Missing data is not a reason to collect a substitute browser identifier. Do not combine performance entries with unrelated signals to infer a person or a device class.
Test observer overhead
Test the observer as a feature with an explicit budget. Compare the journey with the observer disabled and enabled using the same fixture, browser setup, route, and sample window. Check user-visible completion, callback count, retained memory, and the selected aggregate. Repeat with a full queue, a cancellation, a navigation away, and an unsupported type. The expected result is a usable page and bounded cleanup in every branch.
Keep correctness separate from speed. First assert that the main action completes and that late callbacks cannot overwrite the current view. Then inspect aggregate distributions. Use percentiles and sample counts; do not publish a universal service cutoff or detector rule. A changed p95 can reflect server load, cache state, scheduling, or a browser release rather than an application regression.
For production review, freeze entry allowlists, fixture inputs, browser setup, aggregation, retention, and rollback conditions. Record negative evidence such as an empty paint list or an unsupported type. Re-run the smallest fixture after a release change before widening the observation window. The safe sequence is: define one owned question, observe only needed entries, cap and clean up, aggregate comparable runs, and retain the smallest useful evidence.
Build an observation contract.
Write the observation contract before adding code. Name the user action, the browser event that represents progress, the acceptable fallback, and the owner of the result. A product search may own the transition from submit to the first usable result list, while the server owns request processing time. A PerformanceObserver record can support the first question but cannot replace the server record.
Keep the contract narrow enough to test in one fixture. Use a known input, route, release label, and visible assertion. Do not depend on customer content or an unbounded background feed. When a fixture needs a network response, use an approved test endpoint and record its fixture id, not its response body.
The contract must say what happens when an entry is unavailable. Continue without the optional measurement, show a neutral status, or select a supported type. Do not block checkout, editing, or navigation because a callback did not arrive. Measurement helps operate a feature; it is not a hidden prerequisite for using it.
Understand entry lifecycles.
An entry moves through creation, delivery, aggregation, and cleanup. buffered: true asks for matching entries that already exist; it does not freeze the list or promise a particular delivery order. A callback can contain several entries, and several callbacks can arrive before the next render. Tolerate batches, empty batches, and late batches.
Navigation entries describe a document lifecycle. Redirects, cache reuse, service workers, and restored pages create different phases. Resource entries describe browser-observed resources and may include assets outside the user action. Paint entries describe reported visual milestones, not a guarantee that every pixel is useful or accessible. Long-task entries show periods of main-thread work, not a complete explanation of who scheduled it.
Use the entry type as a category label. Do not treat a number as identity or as a universal quality score. The same duration means different things with a cold cache, warm cache, visible page, or background page. A context label makes the comparison honest and reduces pressure to collect more signals.
Keep callback work cheap.
The callback runs on the page execution path. Copy allowlisted fields and move heavier aggregation to a later task when possible. Avoid serializing complete entry objects or making network requests there. A callback that blocks the main thread can alter the interaction it observes.
Use a bounded in-memory buffer. Keep the first few entries, a reservoir sample, or counters and selected quantiles, according to the decision. If the application needs only a count of long tasks, do not retain every task object. Document whether a percentile is exact, sampled, or bucketed.
Backpressure applies to observations. When callback volume exceeds its budget, drop optional entries and keep the primary task responsive. Emit one bounded status such as sample-cap-reached; do not retry collection in a tight loop. A missing optional sample is safer than monitoring that consumes the feature's own budget.
Compare runs fairly.
Hold route, fixture, browser release, profile policy, network class, cache state, visibility, and observation window constant. Change one release or configuration at a time. Separate cold-start observations from warm observations and normal completion from cancellation or timeout. Combining these populations hides why a distribution moved.
Publish sample count, percentile method, and missing-entry count beside the aggregate. A small stable fixture can answer a narrow regression question; a noisy route needs a broader window and explicit sampling. A dashboard that shows one number invites overinterpretation.
Interpret distribution shape. A median change with a stable tail may indicate a broad route change; a p99-only change may indicate a rare dependency, queue, or scheduling event. More empty entries may indicate lifecycle or support differences rather than slower work. Use categories to choose the next controlled check, not to create a detector rule or device promise.
Make fallbacks visible.
If an observer is unavailable, preserve input, focus, error text, and the action the user came to complete. If an aggregate is delayed, show the ordinary progress state. If a release check cannot produce an entry, record the limitation for operators while keeping the user-facing path ordinary.
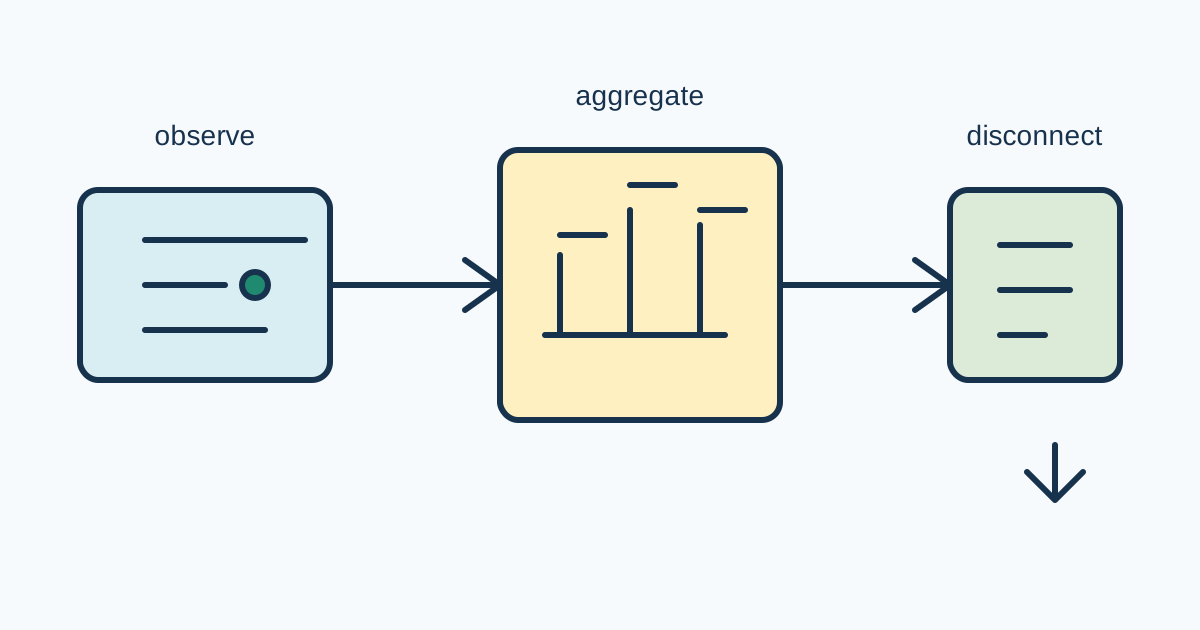
When a component is replaced, protect it from late callbacks with a generation token or active-run object. The callback compares its token before publishing; an older route is ignored. Disconnecting is necessary but not sufficient because a callback may already be queued. Clear old entries, timers, observers, and listeners together.
Operate the evidence.
Store a release record with code revision, observer allowlist, fixture, browser setup, aggregate method, sample window, and retention rule. Include positive and negative outcomes. A note that paint was unsupported or empty prevents missing evidence from being mistaken for a passing zero.
For support, expose only a small diagnostic summary: run label, entry categories, aggregate bucket, fallback state, and release label. Redact query strings, document text, account ids, and unneeded URLs. Do not join the run label to a permanent identity. Delete raw entries and temporary keys after the approved period.
BotBrowser can repeat the same authorized fixture across a declared browser setup and compare visible fallback behavior, supported entry types, and bounded cleanup. It does not set service objectives, remove scheduling noise, guarantee production capacity, or certify that an aggregate explains a user's experience. Keep those limitations in the release record.
For adjacent operational context, see the browser performance optimization guide and the performance timing privacy guide. The first covers capacity baselines; the second covers timing-surface privacy. Neither replaces this article's observer ownership and cleanup contract.
When several observers exist, keep each purpose and allowlist explicit instead of combining unrelated journeys into one opaque score. A release record can contain several small aggregates, each tied to an owner and a visible outcome. This is easier to debug than one number built from routes with different cache, visibility, and network conditions.
When a browser update changes delivery, compare support and lifecycle labels before changing application code. An empty list may be expected for a background page, a restored document, or a type unavailable in that context. Re-run the approved fixture, inspect the fallback, and record the result. Do not widen collection merely to preserve an old dashboard shape.
An operational review also needs a stop condition. Stop when the sample cap, time window, memory budget, or callback budget is reached. Emit a bounded status and preserve the primary action. Do not start another observer automatically. Explicit stops make aggregate counts meaningful and prevent a quiet monitoring loop from consuming resources.
A practical rollout sequence.
Start in a development fixture where the route, input, and browser release are fixed. Install the observer before the action begins, exercise the action once, and inspect the selected entry types. Then repeat with the observer disabled. The visible result, focus behavior, error handling, and cleanup should match. Only the diagnostic aggregate should differ. This comparison catches observer code that accidentally changes the application path.
Move to an approved staging route with the same release configuration used by production. Keep the sample cap low at first and inspect callback count and retained memory. Increase the cap only when the primary action remains responsive. If a larger cap changes the visible result, keep the smaller cap and investigate the observer overhead instead of treating the change as a performance finding.
Use a canary window before adding the aggregate to a broad dashboard. The canary record should state the route, fixture, browser setup, sample policy, and fallback. Compare the canary distribution with the existing approved baseline. A difference is a prompt for a controlled check, not proof that the browser, network, or application alone caused the change. Keep the baseline immutable so later comparisons remain meaningful.
Ownership and cleanup checklist.
The component that starts an observation owns its observer, timers, retained entries, and export decision. It should expose a single cleanup function that is safe to call twice. Cleanup runs after success, error, cancellation, timeout, route replacement, and page teardown. The function disconnects the observer, clears references, and marks the run inactive. A later callback checks the inactive state before doing any work.
Do not share an observer between unrelated product areas merely to reduce object count. Shared ownership makes it unclear which component may disconnect, which data may be retained, and which route a sample describes. If a platform service owns a shared observer, it must expose a narrow subscription contract, cap each subscriber, and remove subscriptions when a route ends. The article's fixture should test the ownership boundary that the product actually uses.
Data review questions.
Before exporting an aggregate, ask whether the field changes a decision. Entry type usually does; a full URL often does not. A duration bucket may be enough where a raw floating-point value adds no decision value. A release label helps reproduce a regression; an account id usually does not. A fixture id lets support repeat a test without copying customer content. Write these choices into the release record so later edits do not silently widen collection.
Review retention separately for raw entries, aggregates, and support joins. Raw entries may be discarded at the end of a short diagnostic task. Aggregates may remain for a release window. A temporary run id may link records for support and then expire. The fact that an aggregate is less detailed does not make it harmless by default; it still needs an owner, purpose, access policy, and deletion rule.
What a healthy result means.
Application health is a product decision, not a browser property. A healthy result means the owned action completed, the visible state is understandable, the fallback is reachable, and the evidence is sufficient for the stated operational question. It does not mean that every entry type was available or that the same duration will appear on every host. Keep the product outcome and the measurement capability in separate fields.
When a route reports an empty list, first verify lifecycle and support. When it reports a large duration, first verify cache, route, server, and visibility context. When it reports a callback after replacement, verify the active-run guard. These checks are more useful than adding another browser signal. They also keep the diagnostic surface small and explainable to a support operator.
Use categories to choose the next controlled check, not to create a detector rule or device promise.
Public sources
Related Articles
Take BotBrowser from research to production
The guides cover the model first, then move into cross-platform validation, isolated contexts, and scale-ready browser deployment.