Browser Performance Measurement with the User Timing API
Measure owned application journeys with marks and measures, interpret noisy results, and keep timing data privacy-safe.
BotBrowser Team
Want the structured docs for Platform?
This article lives in the editorial library. For step-by-step setup, reference material, and ongoing updates, jump into the docs section.
The User Timing API lets an application name points in its own work and measure the interval between them. Use it to answer a bounded question such as “how long did checkout validation take in this release?” It is not a device benchmark, an identity signal, or permission to collect every timing value a user exposes. A useful measurement starts with a visible outcome, places both boundaries where the application can explain them, and records only the fields needed to decide what to change.
Performance marks and measures
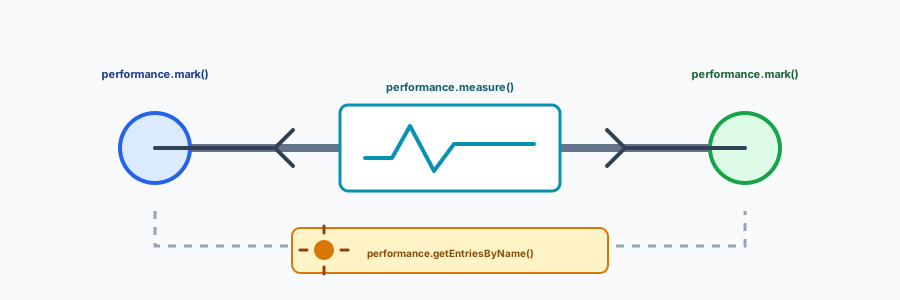
performance.mark(name) records a named point on the document timeline. performance.measure(name, startMark, endMark) creates an interval between two marks. The names belong to the application, so choose stable names that describe a user-visible step: search-submit-start, results-visible, or payment-validation-complete. A measure is useful when its start and end represent the same release-owned contract.
performance.mark('cart-submit-start');
try {
  await validateCart();
  performance.mark('cart-submit-end');
  performance.measure('cart-submit', 'cart-submit-start', 'cart-submit-end');
} finally {
  performance.clearMarks('cart-submit-start');
  performance.clearMarks('cart-submit-end');
}
The W3C User Timing Level 3 specification defines the mark and measure entries. The MDN User Timing API reference documents browser-facing methods and availability. Feature-detect the methods, handle a missing mark or rejected operation, and keep the primary task usable when measurement is unavailable. Do not infer a hardware class from one duration.
The example deliberately measures only the successful validation path. In a real component, keep the status of the operation separate from the duration: a rejected validation remains a validation failure even if a duration can be computed, while a missing end mark means no interval should be published. If the browser does not expose the expected methods, the application should continue through its ordinary code path and omit the measurement. Measurement is optional instrumentation, not a prerequisite for completing the user action.
Use a try/finally boundary so failed, cancelled, and successful paths clean up their own marks. A measure created before an exception can otherwise remain in the performance timeline and confuse a later run. Give concurrent work a run-scoped name or a local object that owns its cleanup; never let one component clear another component's marks by using generic names.
The simple fixture has one important limitation: fixed mark names assume that only one submission is active at a time. If a user can submit twice before the first validation settles, use an application-owned run identifier in each name, or store mark ownership in the component instance. The identifier should exist only long enough to pair the start and end. It does not need to encode the user, cart, URL, or submitted values. When a run is cancelled, invalidate that run before a replacement starts so a late promise cannot create a completion mark for the new screen.
Measure owned journeys
Start with the user journey and its acceptance outcome. For a search flow, measure submit-to-results-visible, then separately record request time, parsing time, and rendering time only if each answers a decision the team can act on. Keep navigation timing, resource timing, and User Timing distinct: a mark created by application code cannot prove that the network or server took the same interval.
Measure at the boundary your team owns. A component can mark when it commits visible content; an API client can mark request dispatch and response handling. If a third-party widget controls the end of a step, label that boundary as an observation rather than claiming ownership. Preserve cancellation and retry semantics, and attach a small fixture id rather than the page contents or account identifier.
Choose boundaries based on the decision the team will make. A submit-to-visible interval is appropriate when a release question concerns the complete interaction. It cannot distinguish a slow server from expensive rendering. Splitting the flow into request, parse, and commit intervals can help, but only when the application can act on those components and the added events remain understandable. Avoid placing a mark at every function call: that creates a larger timeline without necessarily explaining the user-visible delay.
Keep the start definition stable between versions. If one version starts timing on a click and the next starts after input validation, the reported change mixes a product change with a measurement change. Document whether the interval includes queueing, retries, animation, or a wait for a rendering frame. If the visible end depends on the next paint, use the application's actual commit/paint policy consistently and describe it as a client-side observation, not proof that a person saw or understood the result.
This article's concrete artifact is the copyable fixture above plus the decision table below. It exercises success, error, cancellation, unsupported API, and a delayed result. Expected behavior is a usable page in every case, one bounded measurement when both marks exist, and no retained mark after cleanup.
| Result | Record | User-facing action |
|---|---|---|
| Both marks exist | one duration and run label | continue normally |
| API unavailable | measurement-unavailable | continue without timing |
| Validation fails | status plus bounded duration if available | show the existing error and retry action |
| User cancels | cancellation status, no invented duration | preserve input and stop work |
| Late completion | ignore if run is obsolete | keep the current view unchanged |
Read the table as an outcome contract, not as a promise that every browser produces an entry. The first row is the only ordinary success measurement. An unavailable API is not a zero-duration result; a failed or cancelled task is not a successful duration; and an old run must not overwrite the screen after a newer action. The owning component should have one place that decides whether an entry can be emitted and one cleanup path that retires only its own names.
For repeatable checks, use an owned fixture with stable, synthetic inputs. Include one expected success, one controlled validation rejection, one cancellation before completion, and one delayed completion made obsolete by a newer run. The success should create exactly one measure. The rejected and cancelled paths should retain their application outcome while cleaning marks. The obsolete path should not update the current result. Keep waits bounded and ensure the fixture can be reset without leaving entries for the next case. This small artifact is more useful than a generic performance checklist because it catches stale completion and ownership mistakes in the same place that the team interprets the measurement.
BotBrowser controlled contexts can run authorized journeys and compare these visible outcomes across a declared browser setup. BotBrowser does not make application work deterministic, change the User Timing specification, or certify that a timing result represents a user's device. Keep capability evidence separate from product performance conclusions.
That distinction matters when a team compares a local fixture with a controlled browser run. The controlled context documents the browser setup and repeats the declared interaction; it does not remove scheduling, network, server, rendering, or host variation. Keep the fixture, browser release, route class, and observation window in the comparison record. A repeatable browser setup improves the interpretability of the experiment, but an application owner still defines the success condition and decides whether an observed change matters to the product.
Data minimization
Collect only fields needed for the decision: measure name, duration bucket or aggregate, release label, fixture id, and outcome. Avoid raw URLs, query strings, text, account ids, and a long-lived per-user timing history. A short run id can join browser, server, and gateway records during a diagnostic window; expire it afterward. Do not combine marks with unrelated browser properties to create a profile.
Before exporting entries, define the receiving system, access group, retention period, and deletion path. A duration is not automatically anonymous merely because it contains no text: repeated events can still describe an individual session when joined with timestamps or other records. Prefer aggregation before transfer when the decision does not require per-run diagnosis. For temporary diagnosis, scope access and expiration to the incident or test window, then remove the join key and detailed trace. The objective is to answer the named engineering question, not to retain everything the timeline makes available.
Clear entries after export or after the component completes. performance.getEntriesByName() and performance.getEntriesByType() expose entries created in the page, so a broad export can include unrelated components. Select an allowlist of names and copy only the fields needed. Keep diagnostic traces behind explicit authorization and retention rules. Clearing the application's marks does not necessarily clear every measure or entry created by other code; cleanup should target the names and entry types the component owns rather than using an indiscriminate timeline reset.
Privacy reduction and missing data are normal. A browser may reduce precision, omit an entry, or expose a different lifecycle after a back-forward cache restore, prerender, service worker response, or page visibility change. Treat those as distinct context labels. Never replace an unavailable value with a synthetic “typical” duration that looks like observed evidence. Also avoid treating the precision of a single reading as a defect: the API's timestamp resolution and the scheduler's variability are part of the observation context, not a promise about wall-clock accuracy.
Interpreting noisy results
Timing distributions vary with cache state, network route, server load, CPU scheduling, page state, browser release, and concurrent work. Compare like with like: the same fixture, route class, release, and observation window. Use percentiles and sample counts, not a single average. A slower p95 with unchanged median may indicate a tail problem; a shift in every percentile may indicate a release or environment change. Keep the denominator visible: a p95 calculated from a handful of runs is not equivalent to one based on a stable larger sample, and reporting a percentile without its sample count hides that difference.
Separate cold and warm conditions when the product question requires both. The first navigation after a deploy may include cache fill or one-time initialization, while later attempts reuse work. Do not mix those states into one distribution unless that mixture represents the real user journey being evaluated. Similarly, compare the same route class and fixture inputs; an aggregate that combines different application states can move because its composition changed rather than because any individual step regressed.
Separate correctness from speed. First assert that the result is visible, the input is preserved, and cleanup ran. Then inspect duration aggregates. Do not set a universal limit from one machine or publish a detector cutoff. A timeout, missing mark, and rejected promise should remain ordinary application outcomes with a documented fallback. A performance target belongs to the product's stated service objective and comparable evidence, not to a number copied from an unrelated device or browser setup.
When a result changes, rerun the smallest deterministic fixture, then compare the surrounding categories: server request timestamps, resource entries, queue delay, and browser release. A User Timing measure can locate the boundary of a regression, but it cannot identify its cause alone. Record negative evidence, such as a parsed response with no visible commit, so future maintainers do not delete a fallback based on an incomplete sample.
Keep the investigation sequence narrow. First reproduce the visible outcome with the same fixture and input. Next verify that the start and end marks still describe the same boundaries and that the expected run was not cancelled or superseded. Then compare supporting observations such as a request interval or resource entry, if those signals are authorized and relevant. If the local fixture does not reproduce, report that result rather than widening collection to unrelated pages or users. A useful measurement narrows a question; it does not justify gathering extra browser data whenever the cause remains unknown.
Release checklist
Freeze the mark names, start/end ownership, fixture inputs, browser setup, sample window, aggregation method, and retention period. Test supported and unsupported API paths, errors, cancellation, retry, repeated runs, localization, and a restored page. Confirm that measurement cleanup cannot remove another component's entries. Review the visible result at desktop and mobile widths.
The safe sequence is: define one owned question; mark the boundaries; measure only when both boundaries exist; clean up; aggregate comparable runs; and retain the smallest useful evidence. That sequence makes performance work explainable without turning application timing into covert measurement. When code changes, review the measurement itself alongside the feature: confirm the same boundary names, cancellation handling, ownership of cleanup, and fallback behavior. A shorter reported duration is not an improvement if the user-visible action became incomplete or the measurement stopped covering the intended work.
For a practical review, record the exact fixture revision, route class, browser release, window, sample count, and aggregation rule. Keep the result summary separate from detailed diagnostic records, and expire temporary identifiers at the end of their approved window. If the evidence cannot support a clear comparison, state what is missing and run a smaller controlled check rather than filling gaps with assumptions. These habits make a regression report reproducible and keep instrumentation proportionate to the question it serves.
There are several common ways to misread a timeline. A mark name can be reused by a second invocation, so a measure may pair the wrong start and end when the work overlaps. A component can clear a mark that another part of the page expected to inspect. A rejected promise can skip the end mark and leave a partial trace. A navigation or visibility transition can mean the original page is no longer the owner of the work. Each case calls for an explicit result such as not-measured, cancelled, or superseded, not a fabricated duration. The status makes it possible to count why a measurement is absent without pretending that absence is zero.
The fixture should also state its reset behavior. Before each run, remove only the entries with the fixture's own prefix; after the run, assert both the outcome and cleanup. If the test observes a shared page, isolate its marks from unrelated components and do not export the entire performance timeline as a shortcut. A deterministic fixture does not require deterministic elapsed time: its value is that the same state transition and cleanup rules can be checked repeatedly while the actual duration remains an observation.
When a product team reviews a change, keep the question and evidence close together. For example, “Did the new validation step delay the visible confirmation?” maps to a start mark before the owned operation, an end at the agreed visible state, and a comparison against the prior release under the same route class. “Is this device fast?” does not map to a User Timing result because the measure contains no controlled device comparison and says nothing about other workloads. A precise question prevents a local timing value from acquiring a broader meaning than its boundaries support.
Treat instrumentation changes as part of the user journey's behavior. A mark should not introduce a dependency that blocks submission, and a cleanup exception should not replace the original application error. If telemetry is temporarily unavailable, the normal interface still needs a correct success, failure, and cancellation state. During rollout, compare functional outcomes first; use the timing distribution to decide where to investigate, not whether the feature worked at all. This ordering keeps a reporting path from silently becoming part of the transaction it was meant to observe.
Finally, document a change in units and scope. User Timing measures are expressed as elapsed time on the document timeline, but a team should still describe whether a value covers one attempt, a retry-inclusive journey, or a specific substep. Keep labels stable enough to compare releases and change them deliberately when semantics change. If a label changes, start a new comparison series instead of placing unlike intervals in one chart. Clear names and a short definition help another engineer reproduce the same boundary without needing access to the original author's memory.
For context on adjacent work, performance timing fingerprinting discusses privacy-sensitive timing surfaces, while performance optimization covers capacity and host-level workload planning. This article addresses a different decision: where an application should measure its own journey and how to interpret that measurement without claiming more than it shows.
Public sources
Related reading
Related Articles
Take BotBrowser from research to production
The guides cover the model first, then move into cross-platform validation, isolated contexts, and scale-ready browser deployment.